Dashboard & Calendar
Overview: period KPIs, recent proposals and pipeline by status.
Dashboard
The first page after you log in - the business overview. Everything respects the date filter at the top (All / 30 days / Quarter / This month / This year / dates).
The first line: what needs doing today
Under the title, the app says what is waiting:
Diogo, today you have 1 overdue task, 1 task for today, 3 cases past SLA and 2 overdue GDPR requests.
Every number is a link to the right place. Anything past its deadline is underlined in amber - it stands apart from what can still be done today. With nothing pending it says "nothing urgent today - a good day to prospect".
Why this replaced the app description
There used to be a sentence explaining what the CRM is. You read it once.
A dashboard that only describes is a poster; one that points is a starting line. The description did not disappear - it just got smaller, underneath.
What it shows
- KPIs for the period: revenue won, average ticket, pipeline, new customers.
- With comparison enabled, each KPI shows ▲▼ X% vs previous period.
- Financial values may appear with 🔒 depending on the role.
- Won revenue per month - bar chart (only Won proposals), with the reading underneath: "Best month: April, with €8,236.08. August has no revenue recorded yet, and 6 days are left." The chart shows; the sentence concludes - which is what UFCD 10868 asks for. With a single month it does not appear: there is no comparison to make.
- Where leads come from - a donut of companies by acquisition channel, with a shortcut to ROI by channel in Analytics, where the real analysis lives (conversion and value generated per channel).
- Pipeline by status - distribution of proposals (donut/bars).
- Recent proposals - latest activity; click to open.
- Learning shortcuts - quick access to Companies, Calendar, Email, etc.
- Target for the month - won revenue for the month against the target, with a bar and a projection "at the current pace it closes at X". If there are individual quotas, it shows yours and everyone else's. You set it in Settings → Sales targets; with no target, the card explains that instead of showing a number on its own.
Notifications
The bell at the top gathers warnings: proposals about to expire (≤15 days), overdue GDPR requests, overdue tasks. Clicking takes you to the item.
Calendar
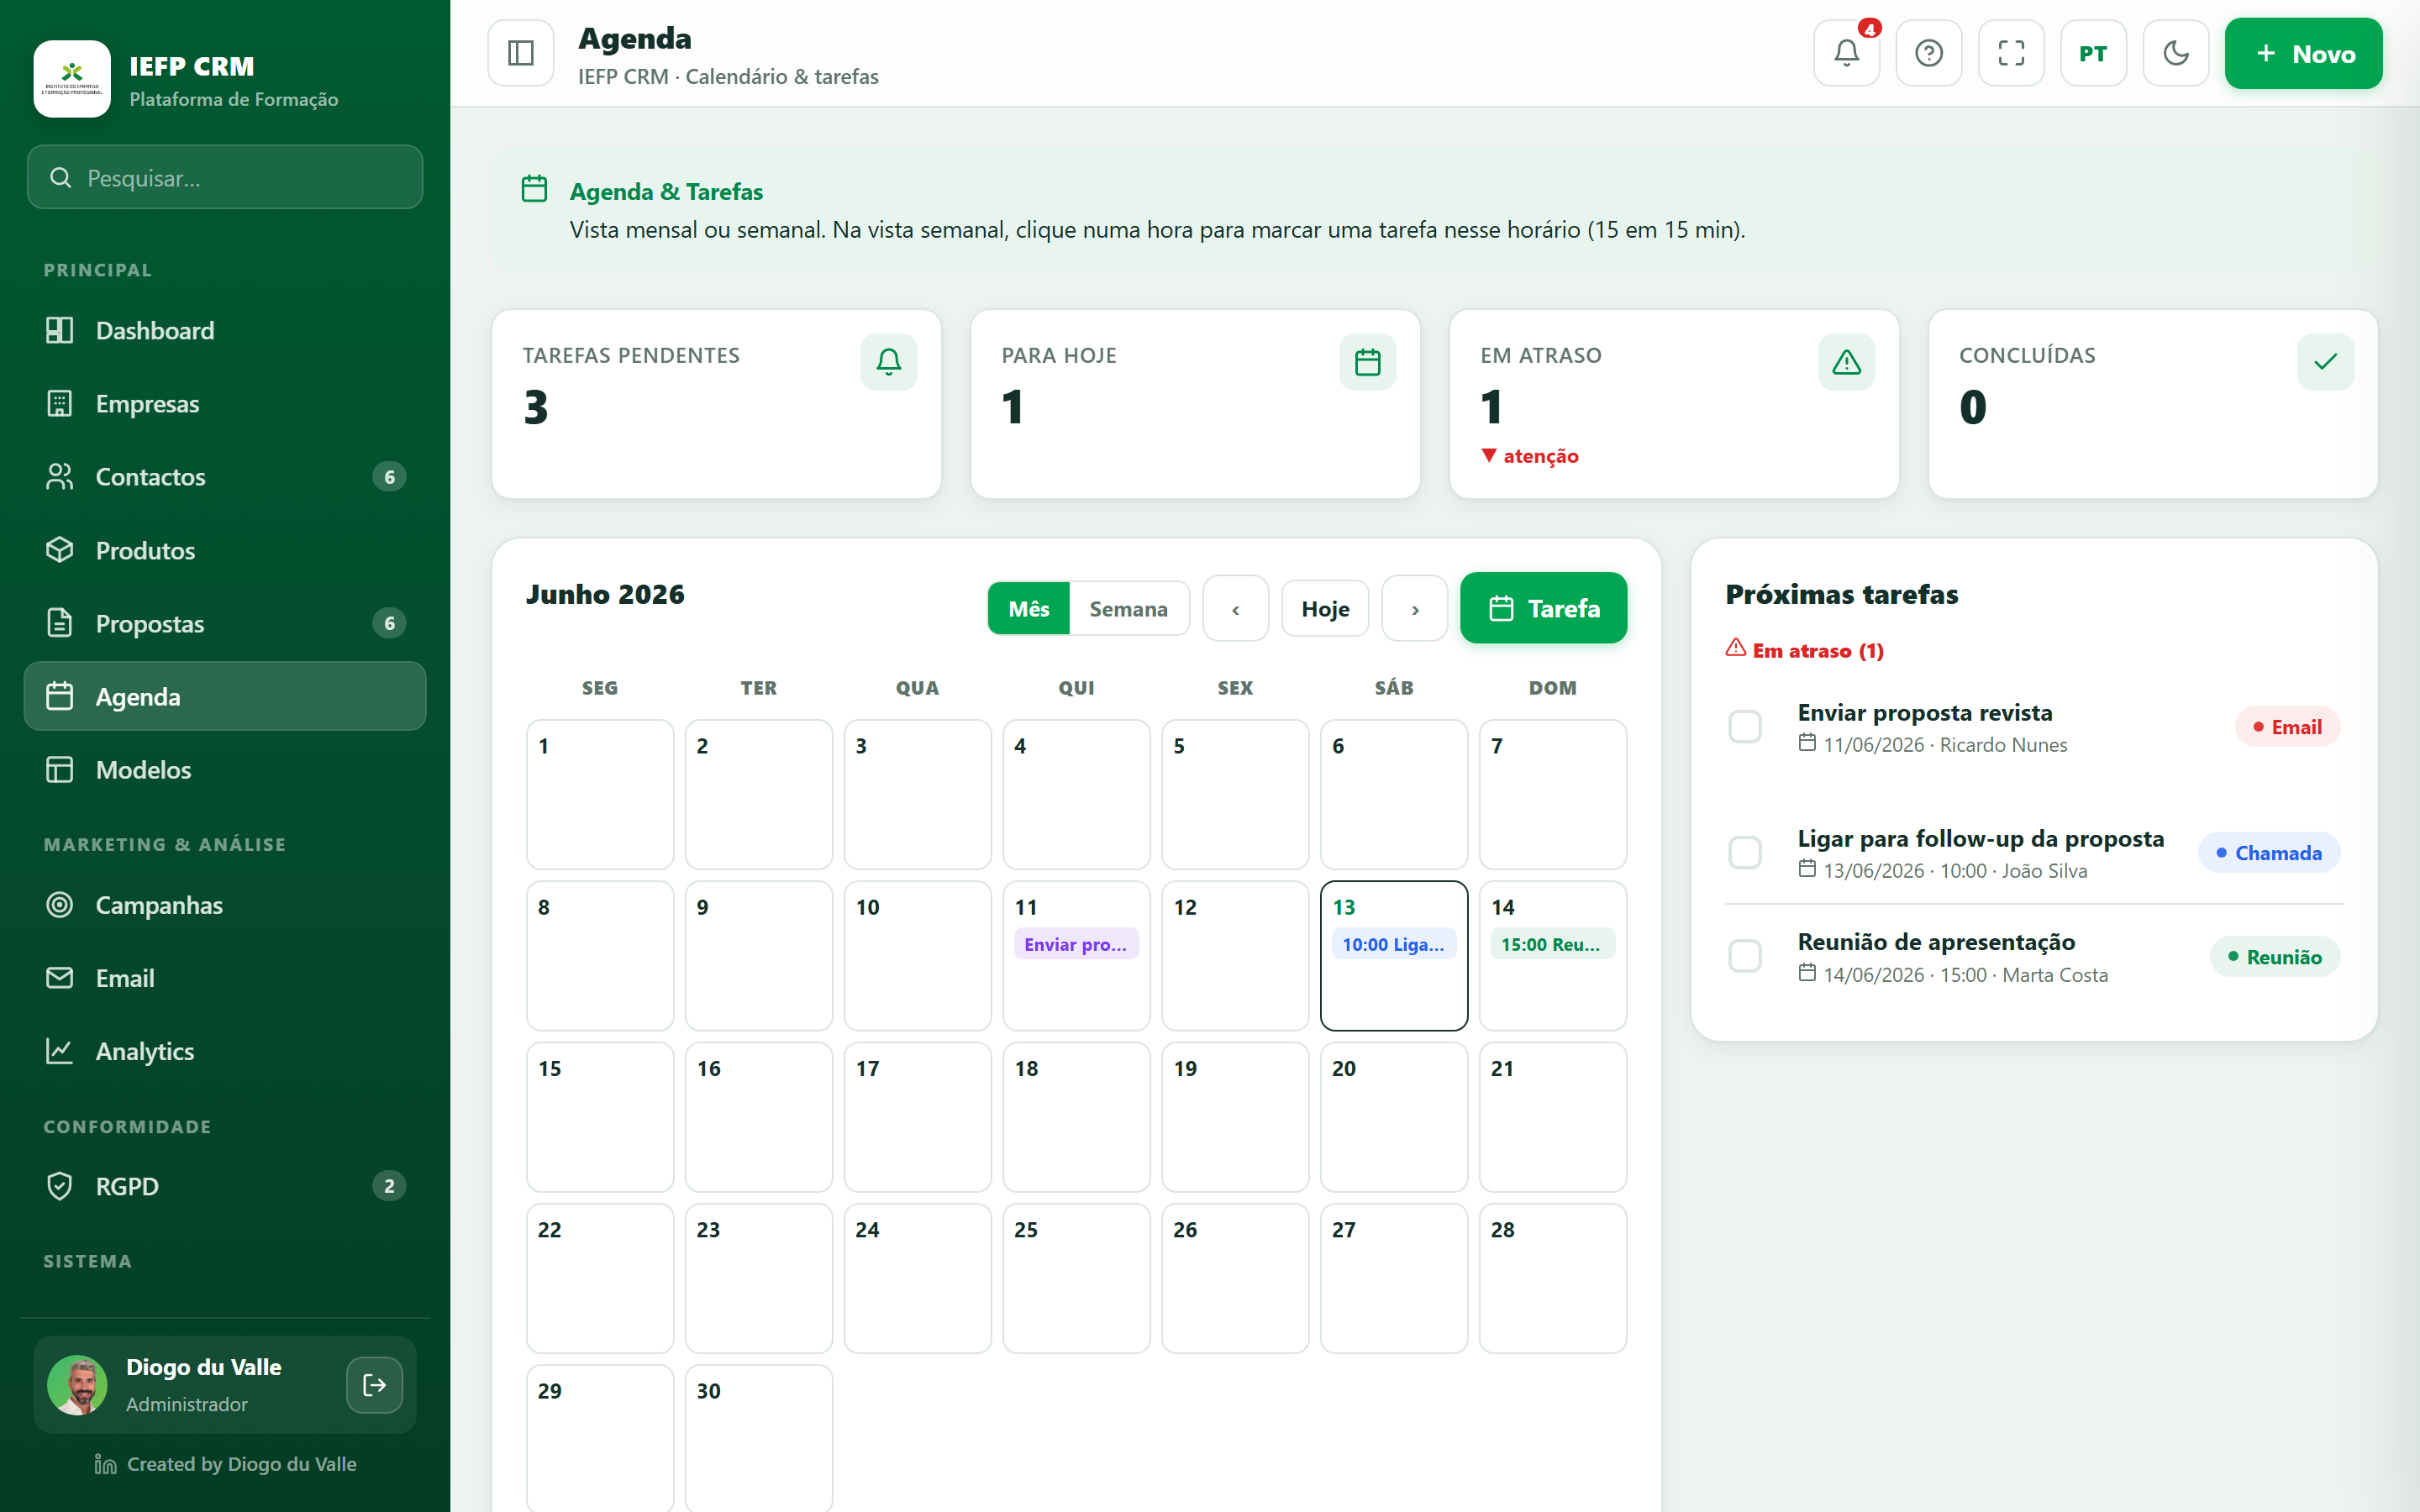
The Calendar: monthly/weekly schedule and tasks linked to clients.
Calendar and tasks associated with customers.
Views
- Month - monthly grid; today is highlighted; each day shows the task chips (up to 3 + “more”).
- Week - hour axis (8am-8pm), Google Calendar style; tasks with a time appear as positioned blocks.
- ‹ › and Today buttons to navigate (move back/forward 7 days in the week view).
Switching view keeps you in the same place
Until August 2026, moving three months forward in Month and clicking Week sent you back to this week: there were two independent cursors that never spoke to each other.
The two views are now the same journey. Month to Week stays in the month you are looking at (in the current month it opens on this week; in any other, on that month's first week). Week to Month goes to the month the week belongs to.
A week can fall across two months, so the rule is the same in both directions: a week belongs to the month of its Thursday (ISO 8601). And the title says so when that happens: "30 Oct - 5 Nov 2026".
Create a task - field by field
Click a day (month view) or an hour (week view) - the date/time are filled in for you. Fields:
- Title required.
- Type - Call / Meeting / Follow-up / Email / Other (each type has a color). Picking Other opens the box to say which - and that is what shows on the list badge ("Site visit", not "Other"). See the "Other" rule.
- Date and Time.
- Duration - 15 / 30 / 45 / 60 / 90 / 120 min.
- Customer associated.
- Status (Pending / Done) and Notes.
Task notes
In the side list (Upcoming tasks), tasks that have notes show a document icon on the right. Click it to read the note without opening the whole record - handy for checking what was agreed just before a call or a meeting.
Manage
- Complete/reopen a task via the checkbox (it gets struck through).
- Today's or overdue tasks enter the Alerts (bell).
Asking instead of looking
Pulso answers "what do I have today" and "do I have overdue tasks" from any module, without coming to the Calendar.
Products & Catalog
The Products menu organizes the catalog (Family → Subfamily → Item) that feeds the proposal lines.